
A chlorophyll meter can support repeat observations of a defined leaf population and, where suitable calibration exists, help assess crop nitrogen status. Its display does not by itself measure total leaf nitrogen or determine a fertilizer dose. Before buying one, identify the quantity it reports and the evidence needed to interpret it for your crop.
The distinction matters when a supplier demonstrates a quick leaf reading. A convenient number becomes useful only when the nursery or production team knows what comparison that number can support.
Follow the optical signal into a supported inference
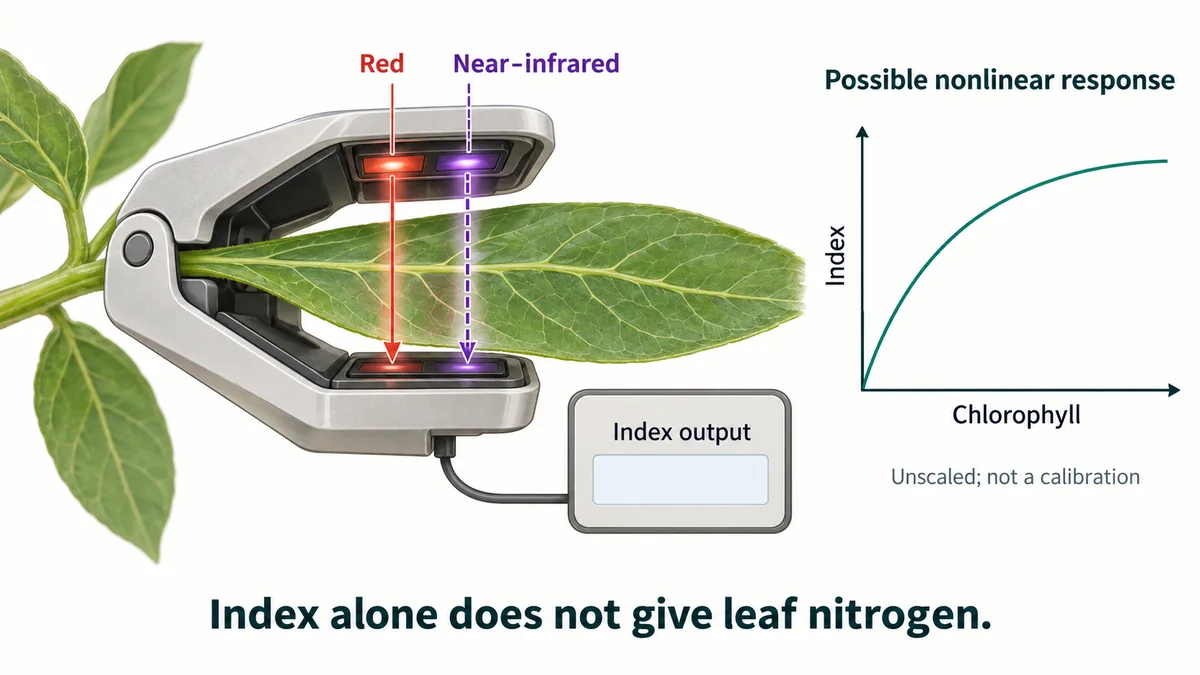
A leaf-clip optical meter sends light through a small leaf area. Chlorophyll absorbs red light differently from near-infrared light, and the instrument uses the optical response to calculate its output. Konica Minolta's SPAD-502Plus brochure describes a two-wavelength measurement producing a SPAD value. That value is an instrument index, not a laboratory nitrogen result.
The reporting mode matters as much as the meter name. Apogee's FAQ distinguishes relative indices such as CCI and SPAD from species-calibrated chlorophyll concentration outputs. Its support page explicitly describes chlorophyll concentration as an estimate derived from a relative measurement. A concentration unit on the screen does not make the instrument a direct chemical analyzer of total leaf nitrogen.
| Step in the interpretation | Evidence needed for the next step |
|---|---|
| Optical leaf measurement | Instrument model, reporting mode and consistent measurement context |
| Named index, such as SPAD or CCI | An applicable relationship between that index and chlorophyll, if concentration is required |
| Estimated chlorophyll per leaf area | Separate crop-specific evidence connecting pigment measurements with the nitrogen question |
| Crop nitrogen interpretation | Plant condition, production context and crop-adviser assessment before a management decision |
Each step answers a different question. The worksheet below keeps them separate so a missing calibration remains visible rather than disappearing behind a precise-looking display.
Why 40 is not necessarily twice the pigment represented by 20
Imagine a fictional operator records a SPAD index of 20 and later records 40. The index doubled. That fact alone does not demonstrate twice the chlorophyll, and it cannot demonstrate twice the nitrogen. Relative index-to-chlorophyll relationships can be nonlinear. Similarly, inserting a CCI result into that series without a supported conversion changes the scale being compared.
A 2018 sweet-pepper experiment at the University of Almería illustrates the issue. Researchers studied Capsicum annuum ‘Melchor’ grown in soil in a plastic greenhouse in Spain. The meters and indices responded differently across the measured chlorophyll range. Several responses flattened toward the upper range, while the MC-100's CCI response did not show that saturation within the study.
This is evidence that response shape matters. It is not a current best-meter ranking, a universal saturation cutoff or a feeding rule for another crop. A flat trend near a meter's less-sensitive range may provide less information than the same-sized change elsewhere on its response curve.
Choose the monitoring job before the instrument
For a grower wanting to compare repeated observations within one crop, start with a defined cultivar, growth stage and leaf position. Decide with the crop adviser whether to revisit identified leaves or sample a consistent defined leaf position as the crop develops. Preserve which approach was used. Quietly switching from older leaves to younger leaves can make a tidy trend difficult to interpret.
For a grower wanting estimated pigment concentration, ask whether the available species setting and calibration cover the intended material and range. For a grower wanting a nitrogen decision, ask what additional crop evidence connects the optical result with that decision. A salesperson's ability to display a number is not that evidence.
In the fictional 20-to-40 example, the next action is to check comparability and the applicable response relationship, then discuss the crop observations with the adviser. It is not to double or halve fertilizer. A pigment change also does not identify the cause of yellowing. Keep photographs and relevant crop observations beside the numerical series.
The wider discipline of matching measurements to events is covered in greenhouse data review and troubleshooting; the optical-to-nitrogen interpretation needs the additional crop evidence described here.
Keep the original scale in the observation record
Download the chlorophyll inference and observation card. This manual tool has no formulas, nitrogen conversion or dose recommendation. Import the UTF-8 comma-separated file, widen columns and wrap text, then save a working copy. Use one column per observation, preserving the original index or unit, instrument mode, species setting, leaf identity and measurement context. Complete the evidence fields at each interpretation step and state what remains unresolved. Add further observation columns only when their definitions remain comparable.